
Enabling a new world for corporate mobility as a service
From urban commutes to city-to-city and country-to-country travel, Mobilleo is your all-in-one solution for managing mobility budgets and global business travel for employees.
Employee Experience
Powering mobility solutions for every employee's needs
Mobilleo is the ideal solution for businesses looking to introduce employee mobility budgets, support colleague journeys to and from work, or make conventional corporate travel to cities and other countries effortless.

Mobility Budget
Help colleagues to save money, reduce their carbon footprint and travel with freedom.

Urban Travel
Simplify employee commutes with integrated public transport and shared mobility services.

City to City
Give your employees the gift of seamless mobility with multi-modal transport to any city.

Country to Country
Effortless global travel designed for the modern business traveller.

Employer Experience
Open your organisation to a new world of employee mobility
Step into a greener, happier, future of business travel with a granular view of your business travel programme.
A mobility as a service platform connecting all forms of travel into one technology solution
Find, book and pay for travel however you'd like across the entire transportation ecosystem. We partner with the very best service providers to give you choice, convenience, and flexibility while travelling.
Features
Business travel, reimagined for the modern traveller. Easy, agile, personalised.
Experience a class-leading user experience across our desktop booker, management suite, and native app solution.
The most complete travel super app
With end to end integrations for every single travel mode and mobility requirement, there's no need to switch between different apps and websites. Simply click and go.

Next level integrated journey planning
Discover the best options for single mode or multi-modal booking journeys. You tell us where you want to go, and we'll be with you every step of the way.


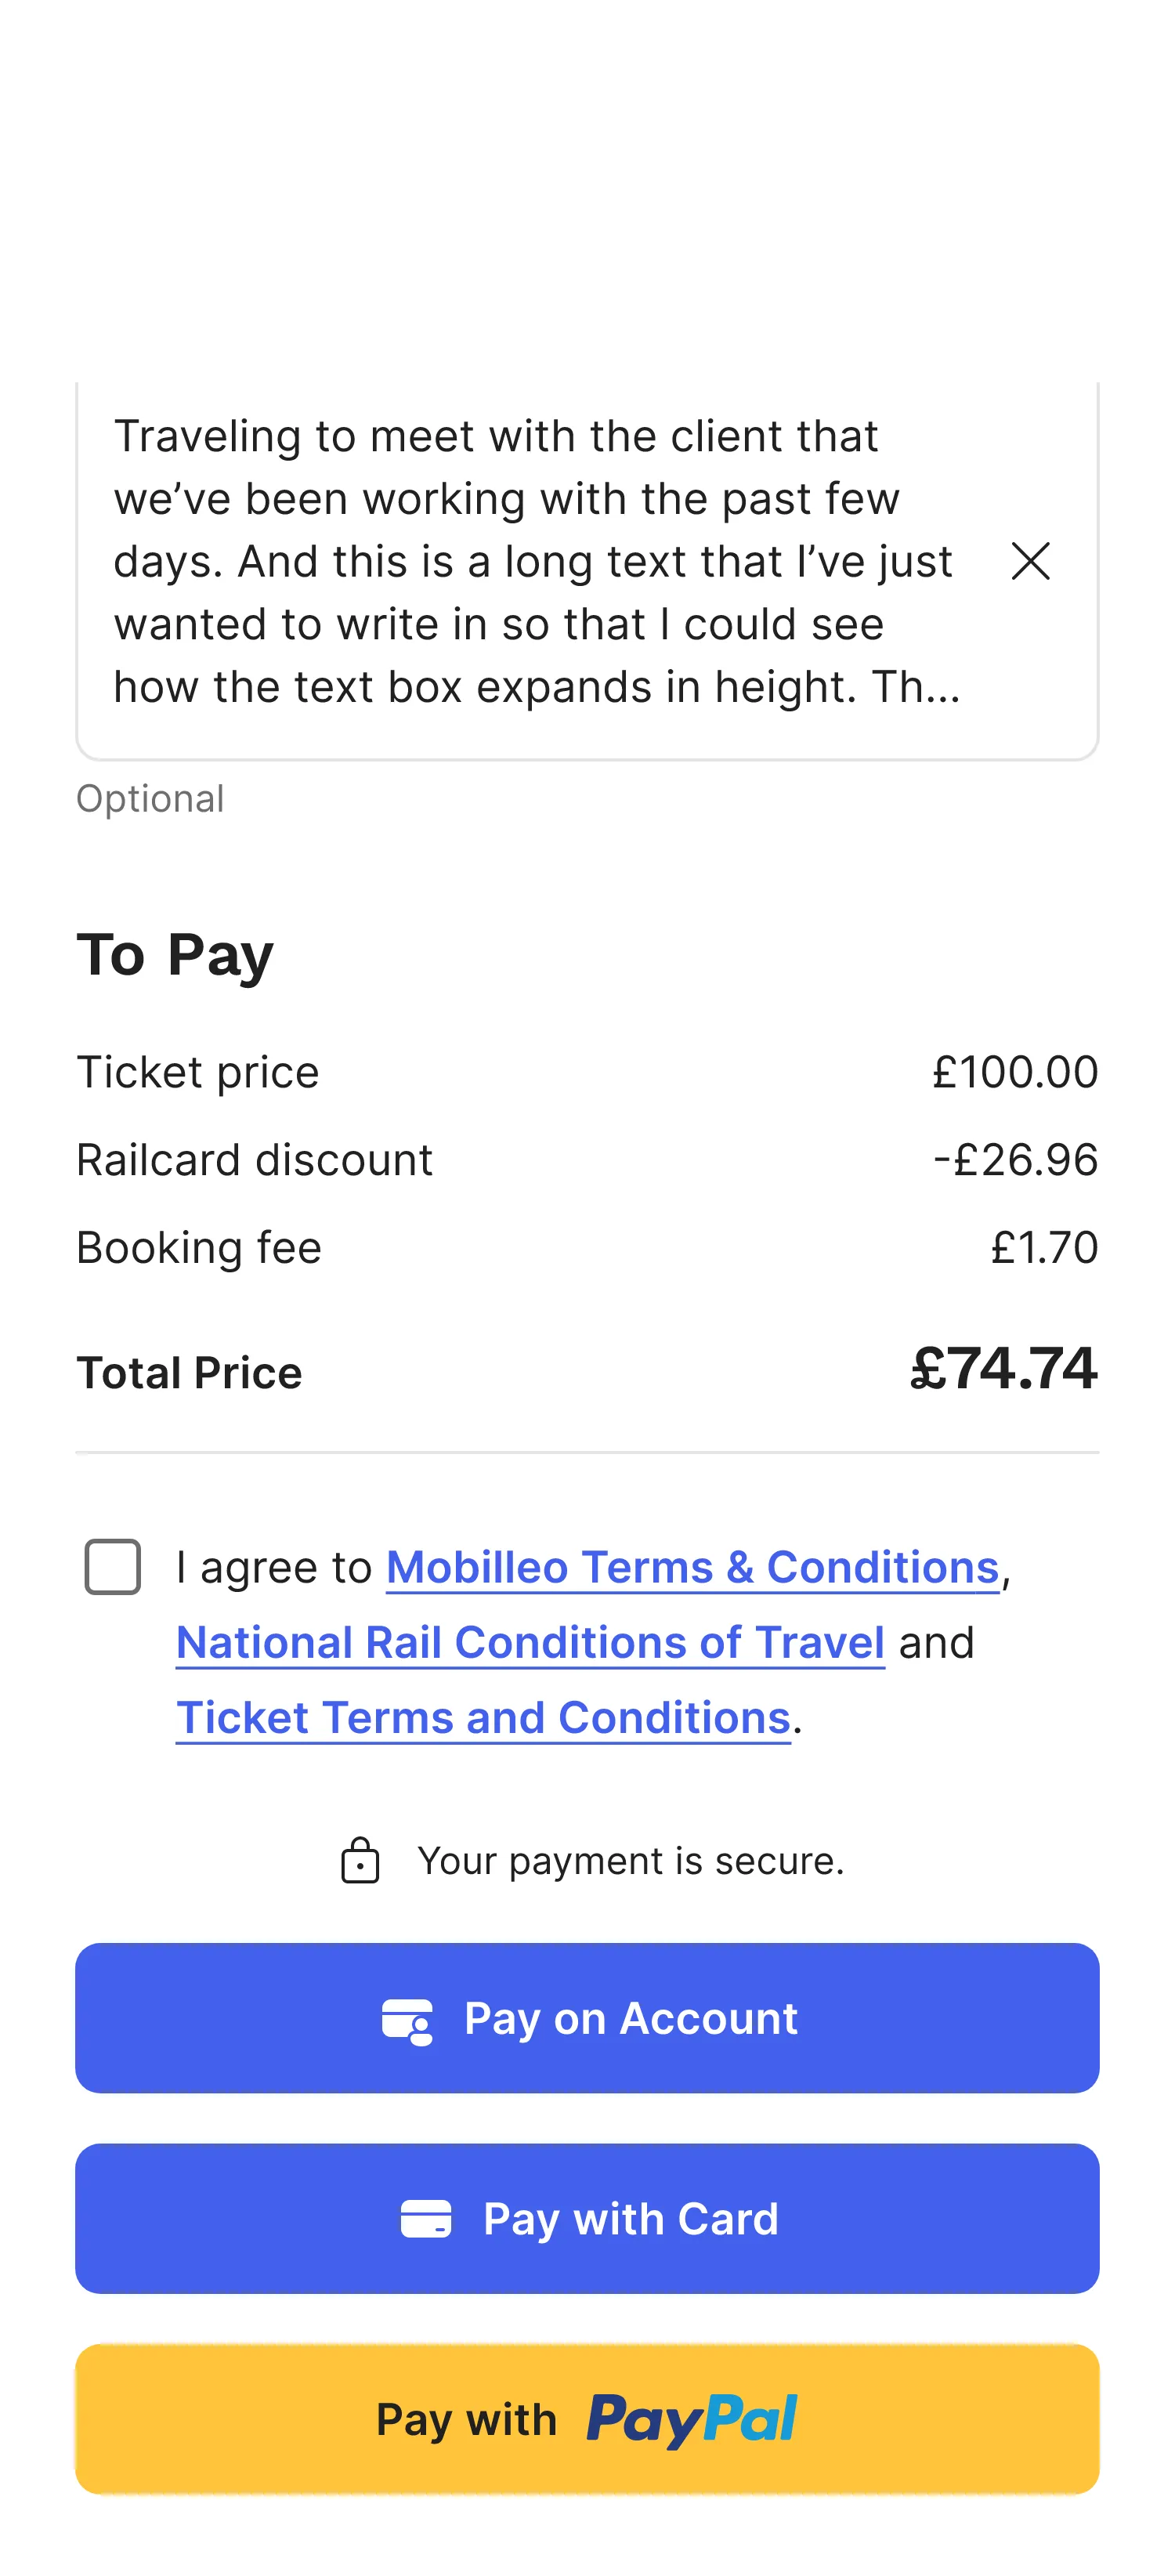
Pay the way you want, hassle-free
Book travel on your corporate account, card, PayPal or mobility budget and generate paperless tickets for easy access.
A powerful mobility reporting suite
Track costs, movement, budgets, and any data you like to define within your business. View context around journeys like CO2 reporting to hit your sustainability goals.

Insights
Read our latest blogs
Discover cost-saving tips, guides to industry terms and best practices, plus the latest news about Mobilleo in our blog section.


Awards
1 min read
FOD Mobility Group recognised for fifth year in a row at Northern Tech Awards 2024
FOD Mobility Group has been recognised for a fifth consecutive year for growth in the technology sector at the Northern Tech Awards 2024.

Awards
3 min read
Go-Hi MaaS app wins Shared Mobility CiTTi Award
Mobilleo is proud to announce that the Go-Hi app has been awarded The Shared Mobility Award at the CiTTi Awards 2023.

News
2 min read
BetterPoints brings sustainable transport incentives and loyalty to Go-Hi MaaS platform
BetterPoints partner with HITRANS Go-Hi MaaS app powered by Mobilleo technology to encourage behaviour change towards sustainable transport.
Download the only travel app you need
Lorem ipsum
Ready to talk to us?
Schedule a complimentary call or request a live demo from our team of experts to experience first-hand how Mobilleo can streamline your business travel programme.
